Vulnerability Management
Vulnerability Management centralizes security findings from multiple sources -- penetration tests, cloud integrations (AWS GuardDuty, IAM), vulnerability scans (HostedScan), code reviews, and manual entry. Each vulnerability is risk-scored, assigned an owner, tracked through remediation with SLA enforcement, and linked to supporting evidence. The module includes an integrated Vulnerability Scanning sub-module for running external infrastructure and application scans directly from the platform.
Overview
Access from Security Operations > Vulnerability Management in the sidebar. The module has two pages:
- Findings -- The vulnerability register for tracking all findings through their lifecycle
- Scanning -- External vulnerability scanning powered by HostedScan (see Vulnerability Scanning)
Vulnerability Register
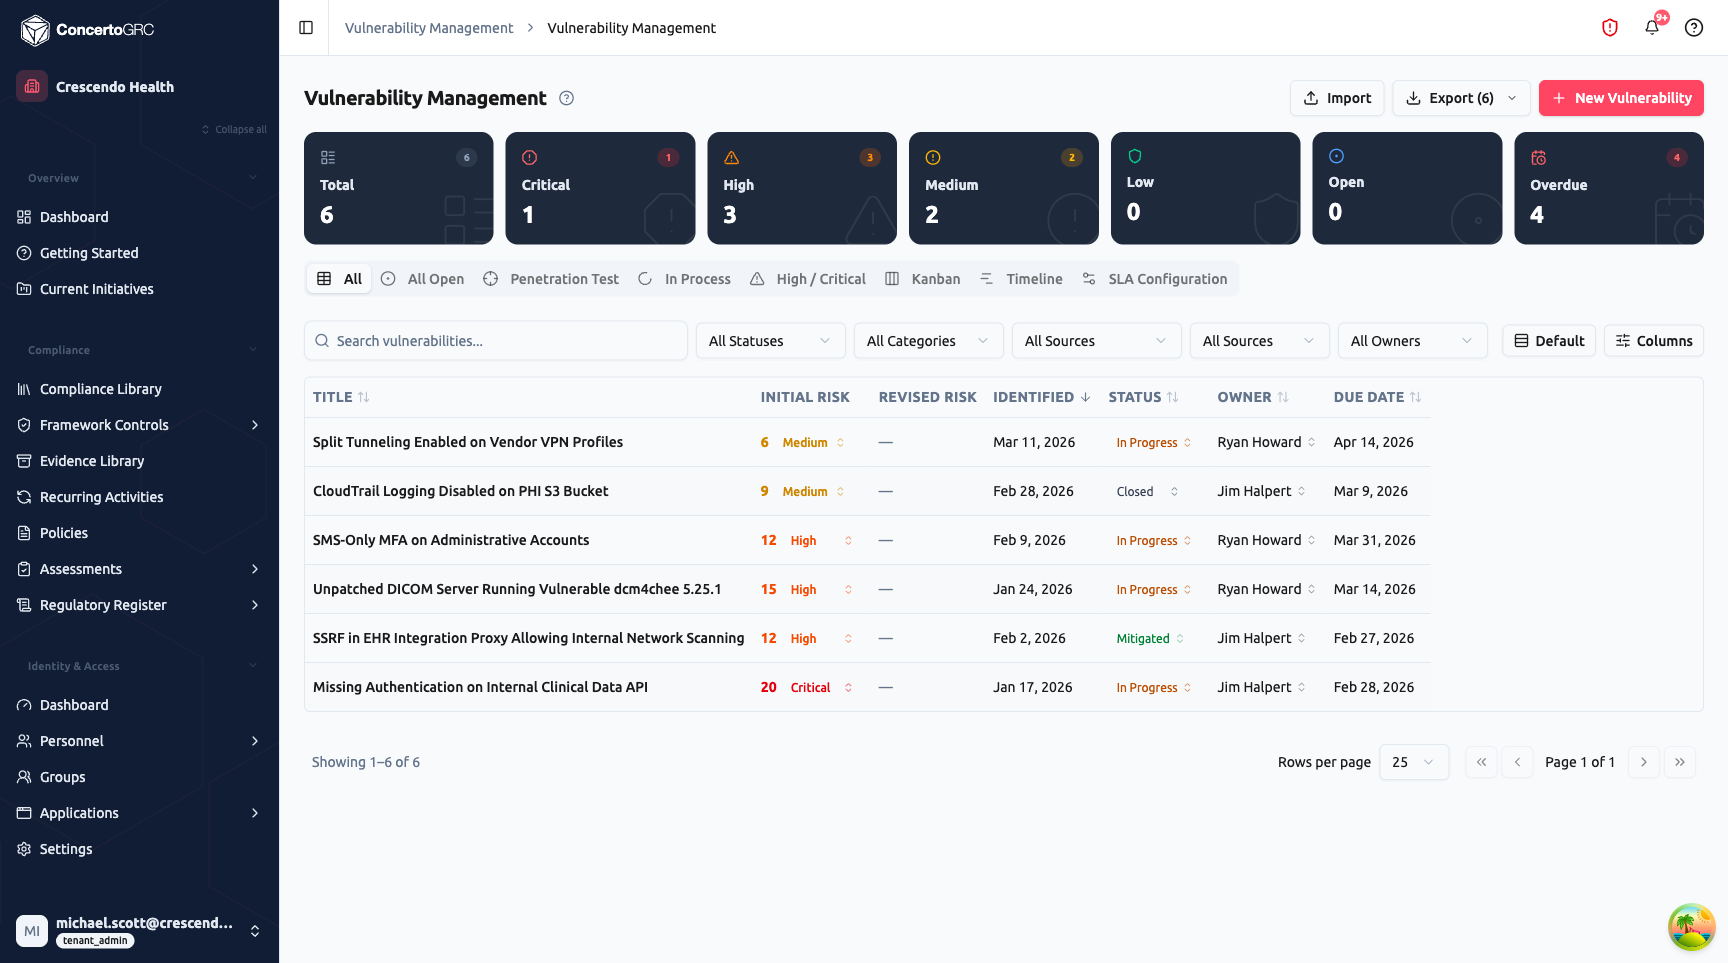
The Findings page shows all vulnerabilities with summary statistics, multiple view tabs, and a detail sidecar.
Summary Statistics
The top bar shows live counts by severity and status:
- Total -- All vulnerabilities
- Critical -- Highest severity findings requiring immediate attention
- High -- Significant findings needing prompt remediation
- Medium -- Moderate findings with standard remediation timelines
- Low -- Minor findings
- Open -- Vulnerabilities in Open status awaiting triage
- Overdue -- Past their SLA-driven due date without resolution
Click any stat card to filter the table.
Vulnerability Table
The default table shows all vulnerabilities with sortable columns:
- Title -- Short description (click to open sidecar, inline editable)
- Initial Risk -- Numeric risk score with color-coded severity badge (Critical, High, Medium, Low)
- Revised Risk -- Updated risk score after reassessment (if applicable)
- Identified -- Date the vulnerability was first detected
- Status -- Lifecycle status with color-coded badge (inline editable)
- Owner -- Assigned person responsible for remediation (inline editable)
- Due Date -- Target remediation deadline (inline editable)
Use the filter bar to search by text, filter by status, category, source integration, identified-during source, or owner. Additional columns are available via the Columns button.
View Tabs
The page provides eight view tabs for different workflows:
| Tab | Purpose |
|---|---|
| All | Full table of all vulnerabilities with filters and sorting |
| All Open | Filtered to Open and In Progress status only |
| Penetration Test | Filtered to findings identified during penetration testing |
| In Process | Filtered to In Progress status for active remediation tracking |
| High / Critical | Filtered to high and critical severity for priority remediation |
| Kanban | Board view with columns by status -- drag cards to change status |
| Timeline | Gantt-style view showing remediation windows by severity |
| SLA Configuration | Define remediation targets, escalation rules, and notification schedules |
Kanban View
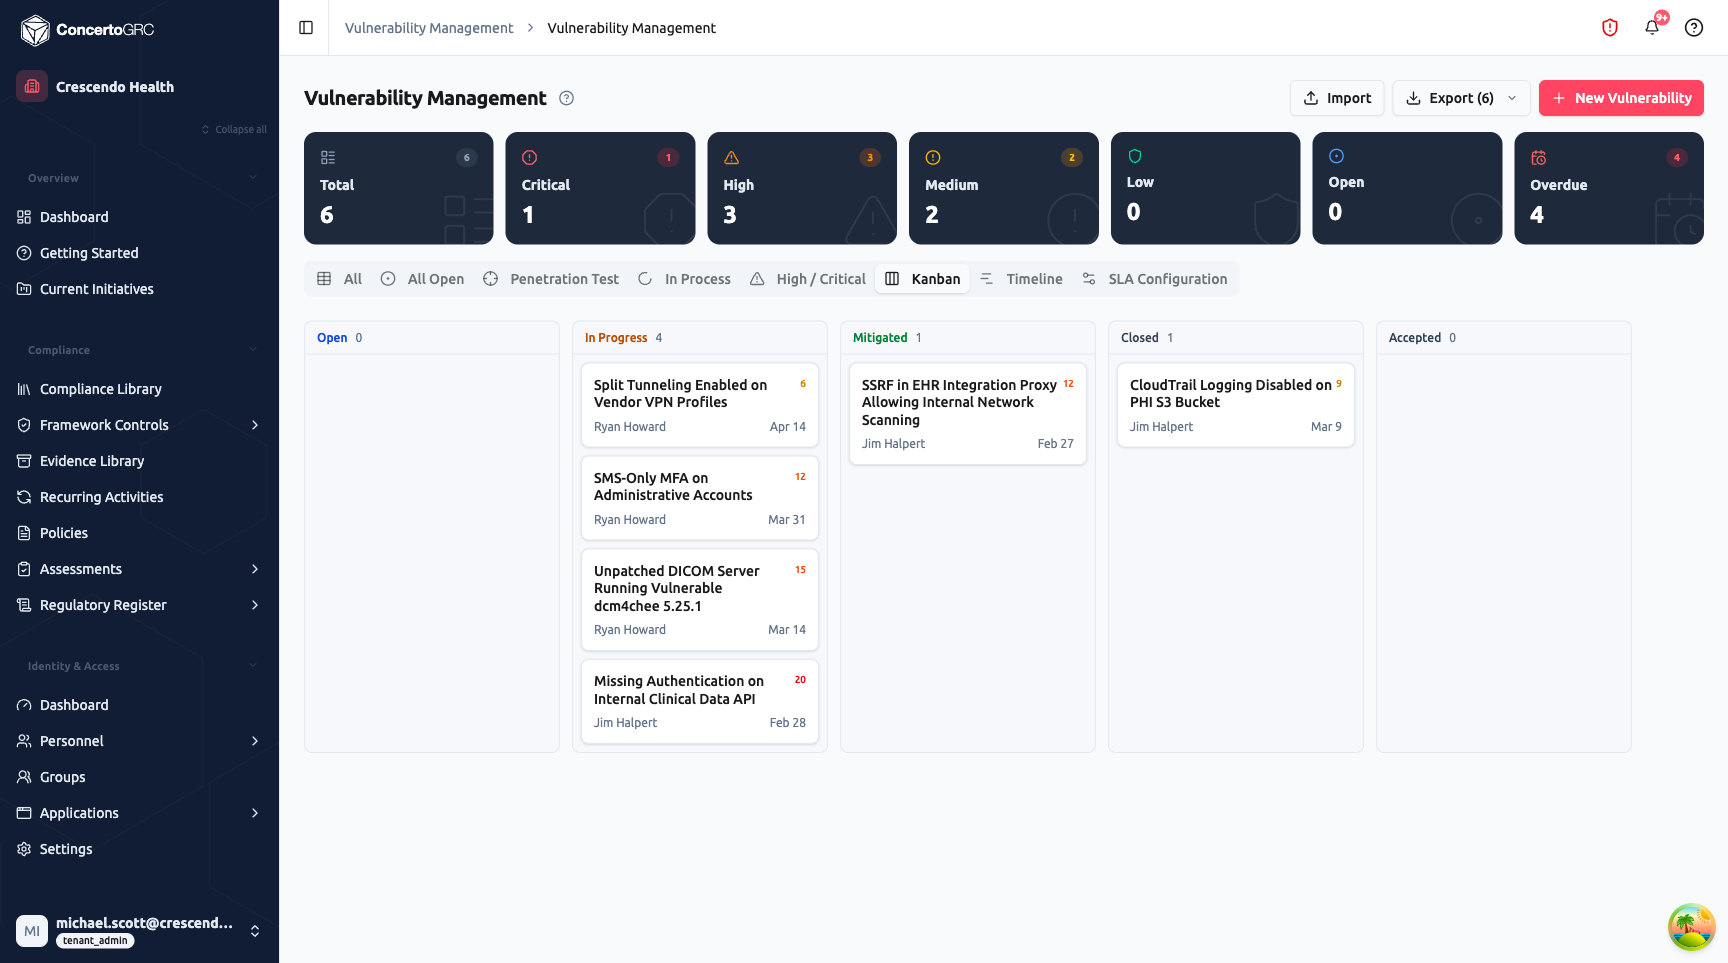
The Kanban view shows vulnerabilities as cards organized by status columns: Open, In Progress, Mitigated, Closed, and Accepted. Each card displays the vulnerability title, risk score badge, owner, and due date. Drag cards between columns to change status.
Timeline View
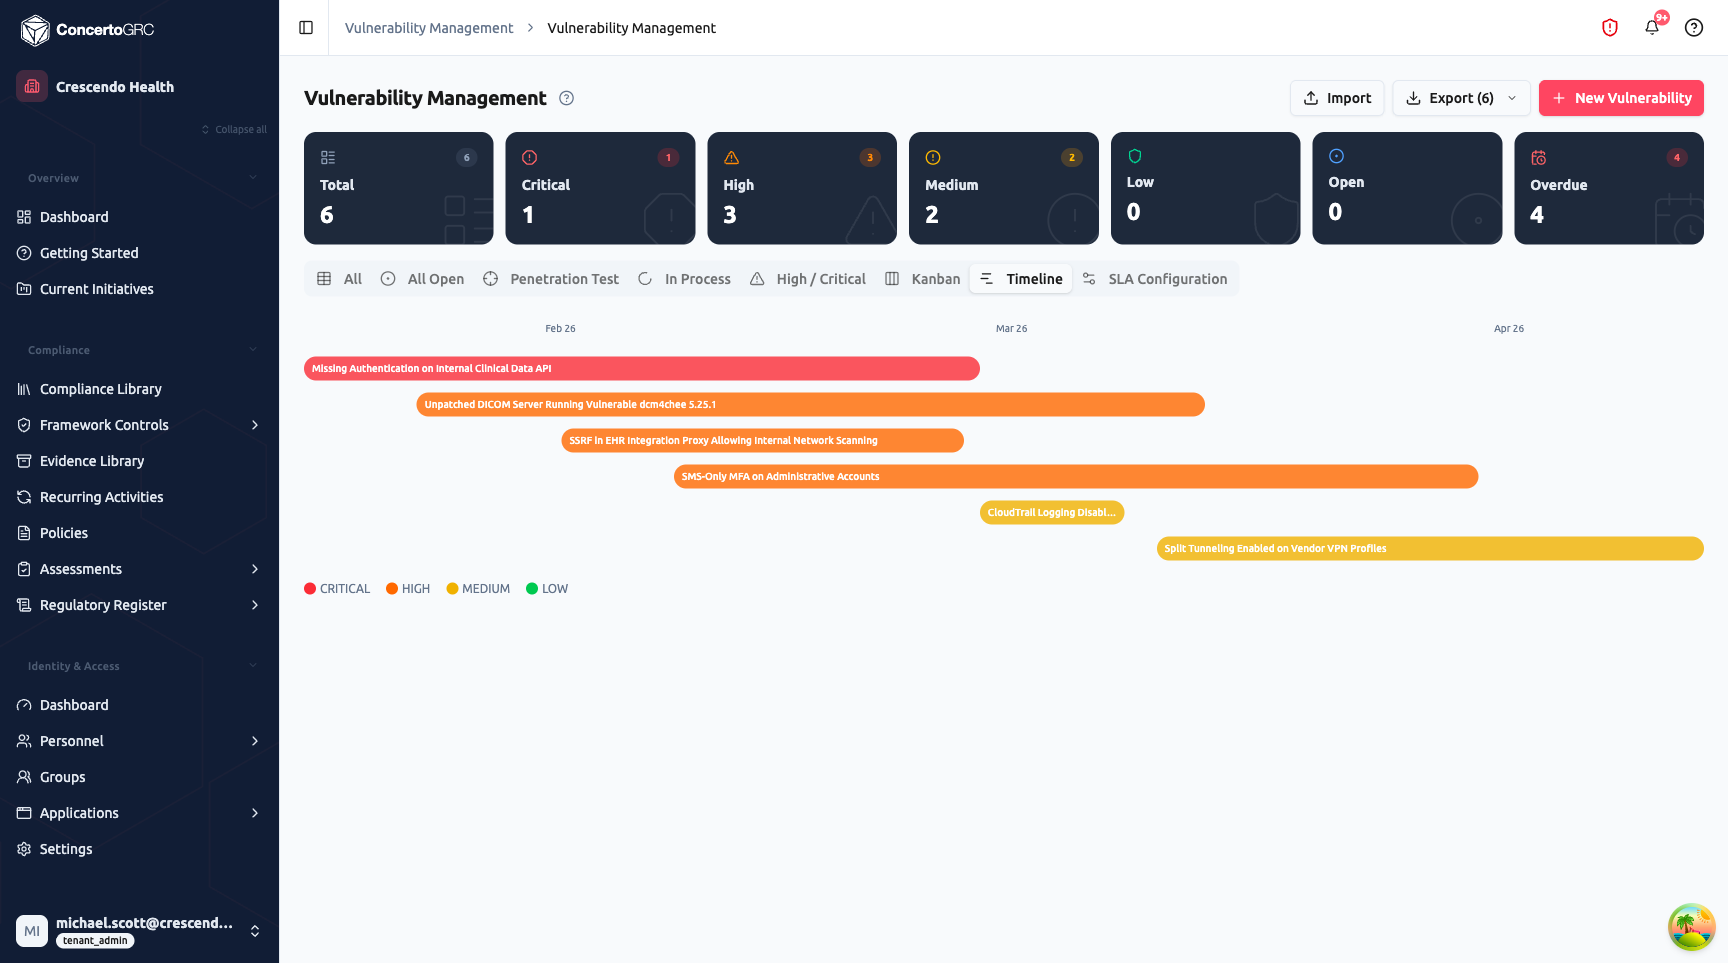
The Timeline view displays vulnerabilities as horizontal bars spanning from their identified date to their due date. Bars are color-coded by severity -- red for Critical, orange for High, yellow for Medium, green for Low. This gives a visual overview of remediation workload and overlapping deadlines.
Vulnerability Detail Sidecar
Click any vulnerability row to open the detail sidecar with five tabs.
Details Tab
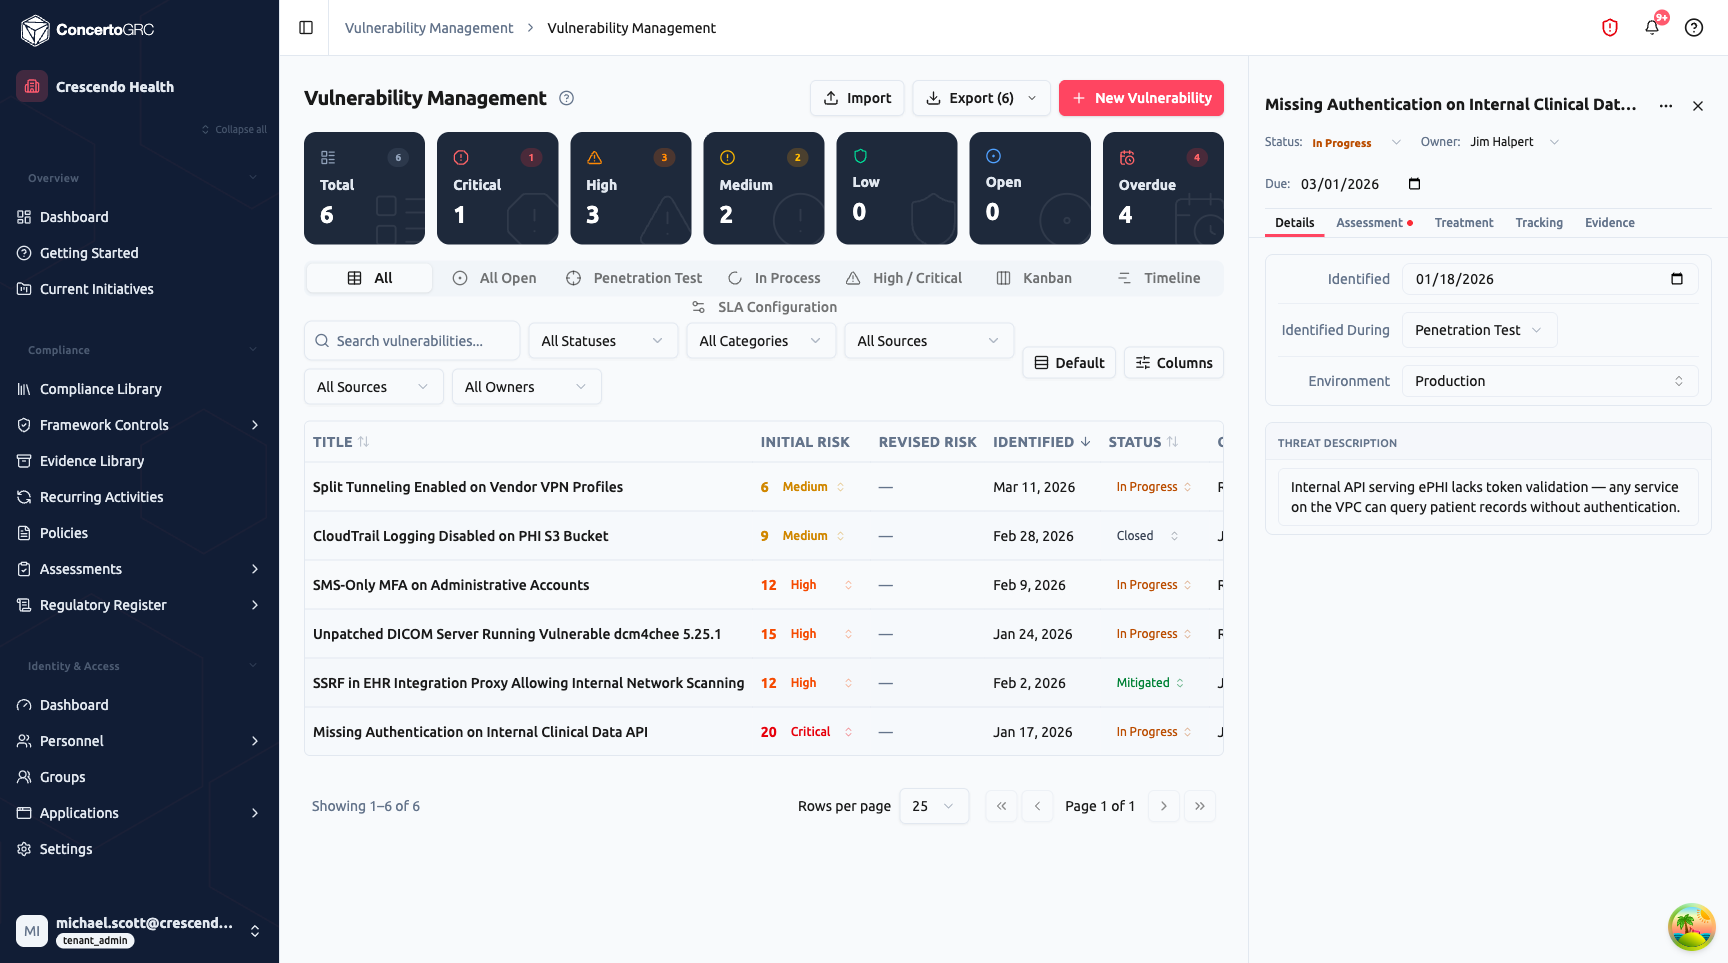
The sidecar header shows the vulnerability title (editable), status dropdown, owner dropdown, and due date picker.
Details Tab Fields:
- Identified -- Date the vulnerability was first discovered
- Identified During -- How it was found: Penetration Test, Vulnerability Scan, Audit, Incident, Code Review, Bug Bounty, GuardDuty Finding, IAM Audit, Nuclei Scan, ZAP Scan, or Other
- Environment -- Where the vulnerability exists: Production, Staging, Development, or All
- Threat Description -- Detailed description of the vulnerability and its potential impact
For vulnerabilities synced from integrations (GuardDuty, IAM), additional read-only fields appear: Affected Asset, Finding Type, External Reference, Remediation Guidance, and Last Seen date.
Assessment Tab
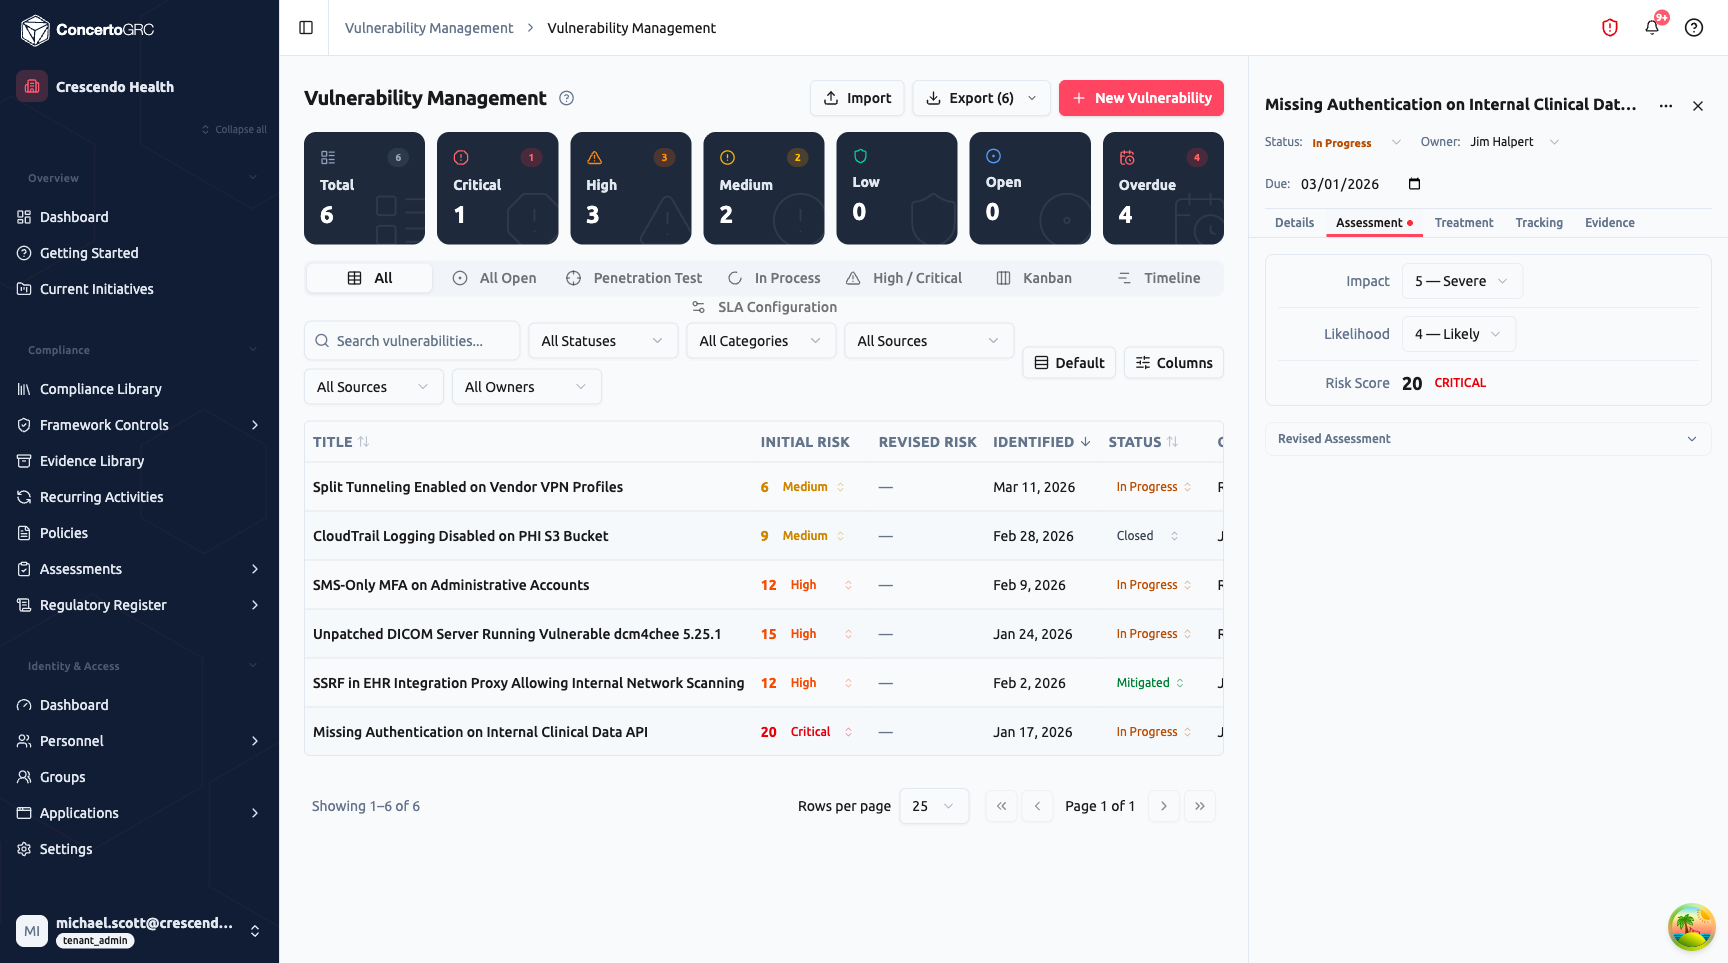
Initial Assessment:
- Impact -- Severity of potential damage (1 = Negligible through 5 = Severe)
- Likelihood -- Probability of exploitation (1 = Rare through 5 = Likely)
- Risk Score -- Computed as Impact x Likelihood, with a color-coded severity badge (Critical, High, Medium, Low)
Revised Assessment: After initial remediation efforts, expand the Revised Assessment section to record updated Impact and Likelihood scores. The revised risk score shows a delta comparison against the initial score, demonstrating risk reduction.
Treatment Tab
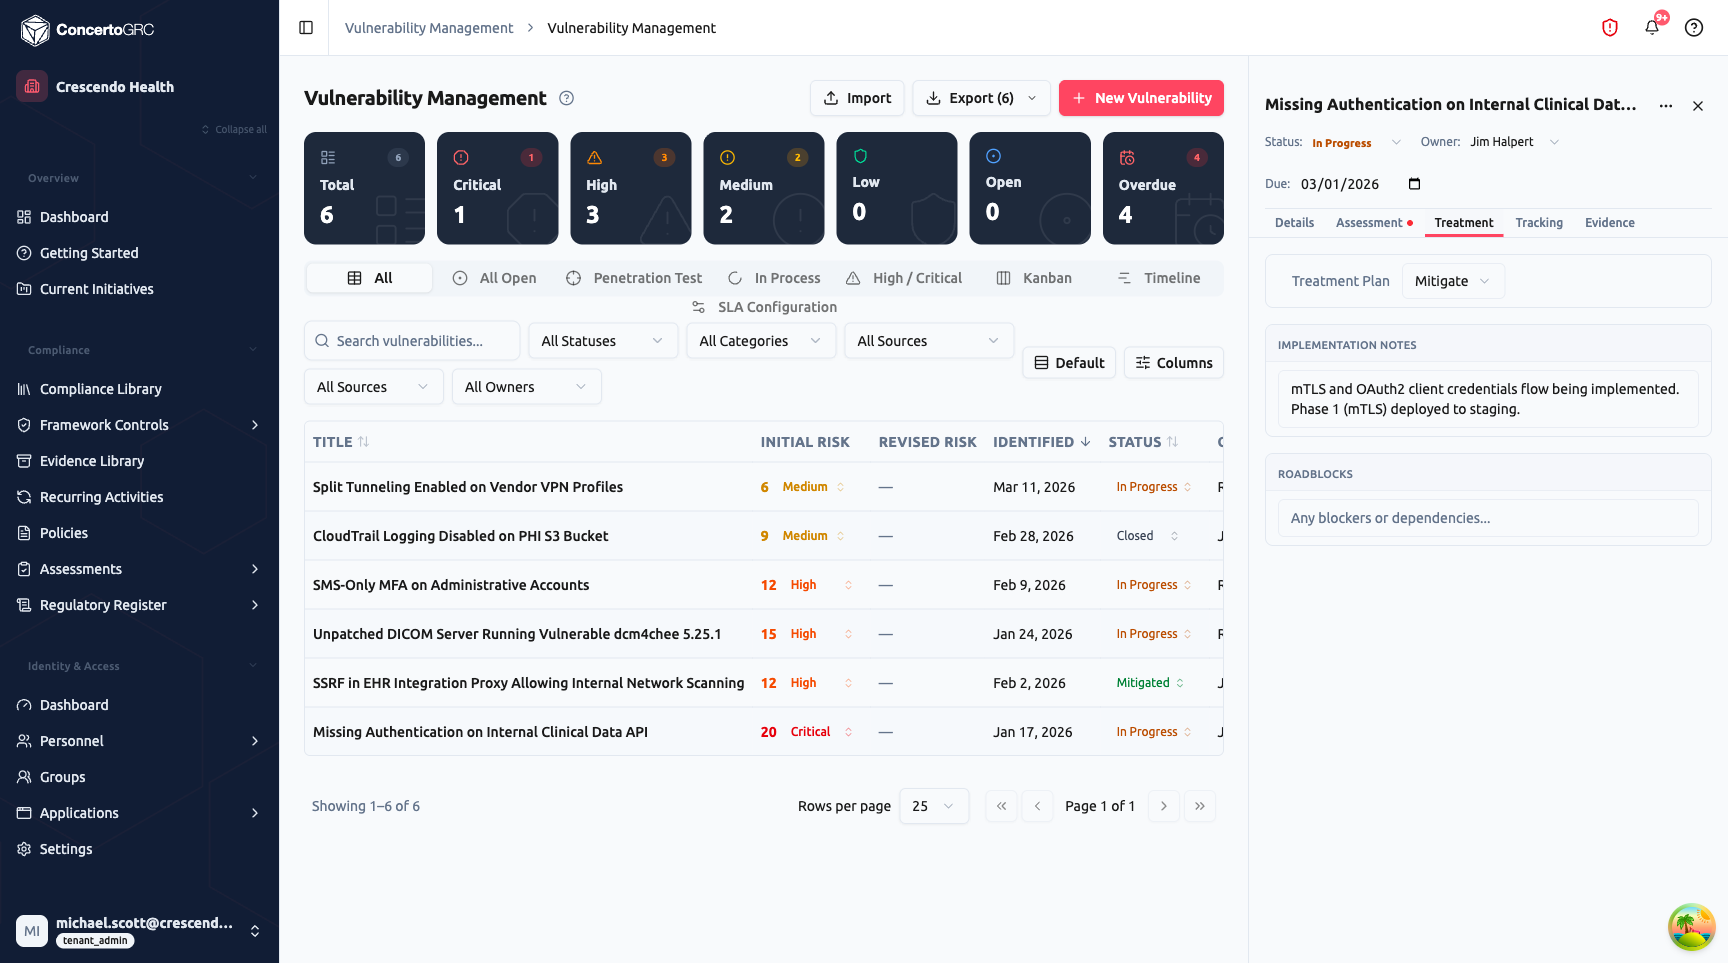
- Treatment Plan -- Choose a strategy: Mitigate, Accept, Transfer, or Avoid
- Implementation Notes -- Describe the remediation approach, progress, and technical details
- Roadblocks -- Document any blockers or dependencies preventing resolution
An AI Remediation button can generate remediation recommendations based on the vulnerability details.
Tracking Tab
- Approved By -- Person who approved the remediation or risk acceptance
- Closed Date -- Date the vulnerability was formally closed
- Required Tasks -- Checklist of action items that must be completed before the vulnerability can be closed. Add tasks inline and check them off as completed.
Evidence Tab
Upload supporting evidence files -- penetration test reports, scan results, remediation screenshots, or configuration exports. Supports drag-and-drop upload for PDF, DOCX, TXT, JSON, PNG, JPG, CSV, and XLSX files (max 25 MB each).
SLA Configuration
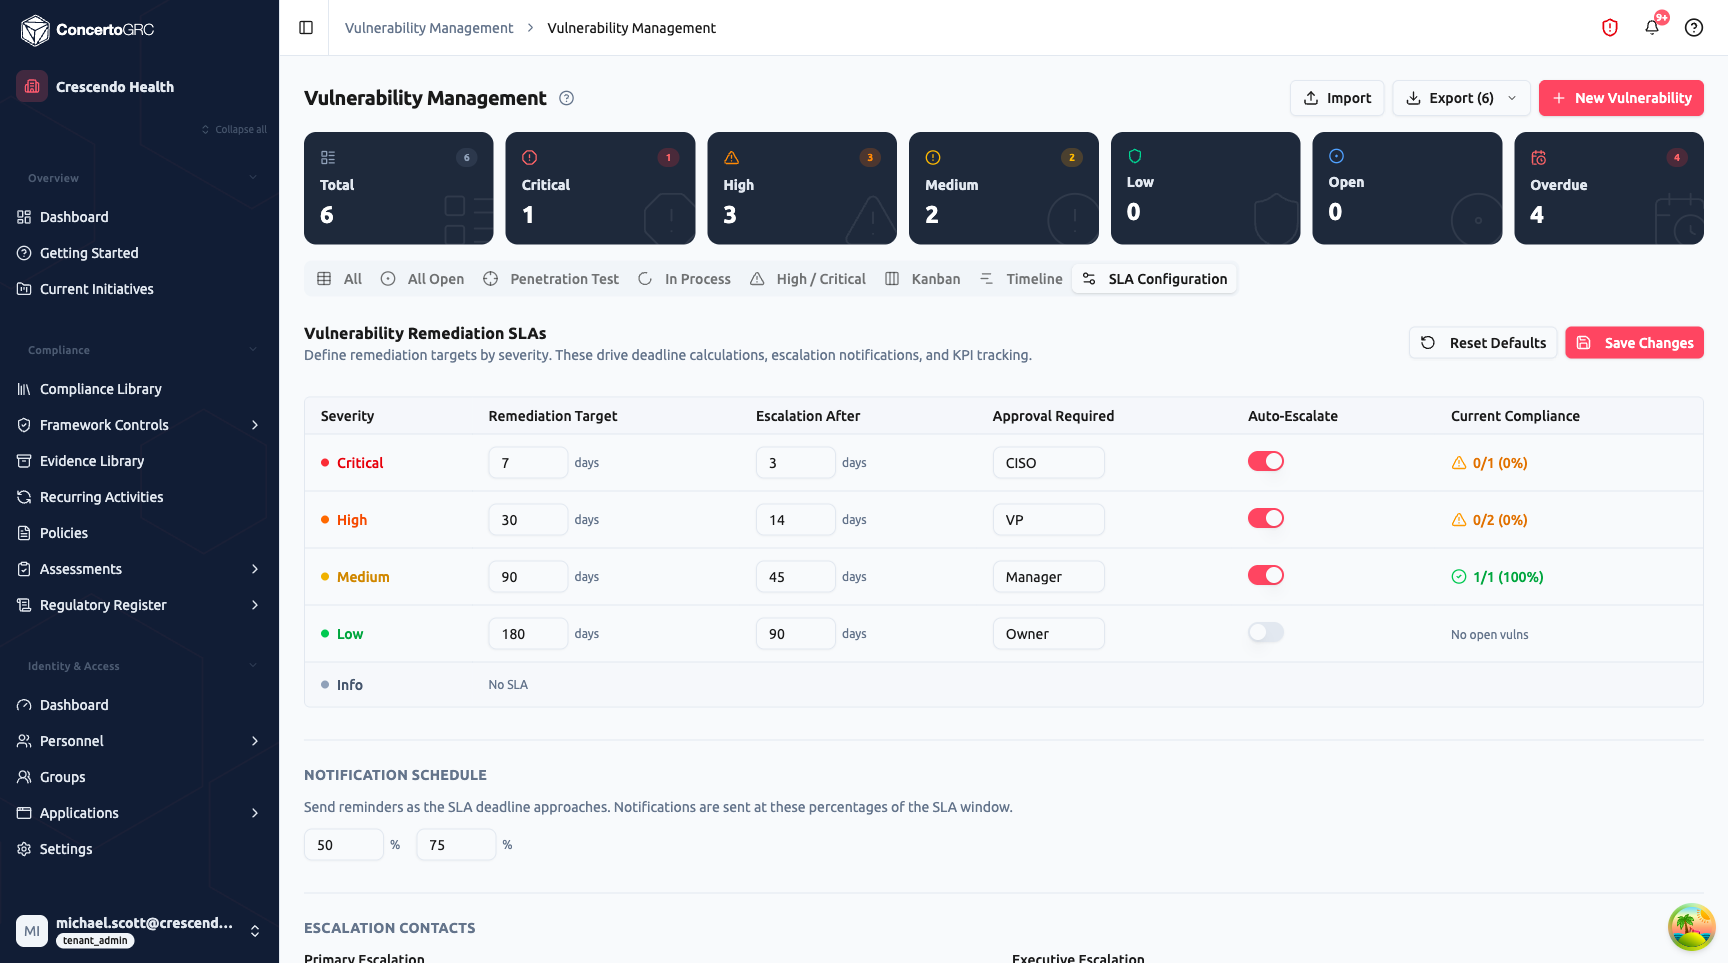
The SLA Configuration tab defines remediation targets and escalation rules by severity. These drive automatic due date calculation, escalation notifications, and compliance tracking.
Remediation Targets:
| Severity | Default Target | Escalation After | Approval Required |
|---|---|---|---|
| Critical | 7 days | 3 days | CISO |
| High | 30 days | 14 days | VP |
| Medium | 90 days | 45 days | Manager |
| Low | 180 days | 90 days | Owner |
| Info | No SLA | -- | -- |
Each severity level has:
- Remediation Target -- Days allowed for remediation
- Escalation After -- Days before escalation triggers
- Approval Required -- Who must approve closure at this severity
- Auto-Escalate -- Toggle to automatically escalate overdue vulnerabilities
- Current Compliance -- Live percentage of vulnerabilities meeting their SLA
Notification Schedule: Configure reminder notifications as percentages of the SLA window (e.g., at 50% and 75% of the remediation target).
Escalation Contacts: Define primary and executive escalation contacts who receive notifications when vulnerabilities breach their SLA.
Creating Vulnerabilities
Click + New Vulnerability to create a manual finding. Fill in the title, select the identification source, set severity via the Assessment tab, assign an owner, and set a due date. The vulnerability opens in the sidecar for further detail entry.
Vulnerability Lifecycle
OPEN > IN_PROGRESS > MITIGATED > CLOSED
                          ↓
                      ACCEPTED
| Status | Description |
|---|---|
| Open | Newly identified, awaiting triage and assignment |
| In Progress | Actively being remediated |
| Mitigated | Remediation applied, awaiting verification or formal closure |
| Closed | Fully remediated and verified |
| Accepted | Risk formally accepted -- documented with justification and approval |
Sources
Vulnerabilities can originate from:
| Source | Description |
|---|---|
| Penetration Test | Findings from external or internal penetration testing engagements |
| Vulnerability Scan | General vulnerability scanning |
| Audit | Findings from compliance audits |
| Incident | Vulnerabilities discovered during incident investigation |
| Code Review | Security issues found in code review |
| Bug Bounty | Reports from bug bounty programs |
| GuardDuty Finding | Automated threat detection from AWS GuardDuty |
| IAM Audit | Misconfigurations from AWS IAM audits (missing MFA, stale keys, overly permissive policies) |
| Nuclei Scan | CVE and misconfiguration findings from Nuclei scans |
| ZAP Scan | DAST findings from OWASP ZAP scans (SQLi, XSS, CSRF) |
Deduplication
Findings from automated scans use fingerprint-based deduplication. If the same vulnerability is detected across multiple scan runs, it updates the existing finding (last seen date, severity) rather than creating duplicates.
Import & Export
- Import -- Bulk import vulnerabilities from CSV
- Export -- Export filtered or all vulnerabilities to CSV. The export button shows the current count (e.g., "Export (6)")
Vulnerability Scanning
The Scanning sub-module provides managed external vulnerability scanning powered by HostedScan. Configure targets, choose from four scan presets (Web App, Network, SSL/TLS, Full Assessment), launch scans on demand or on a schedule, and triage findings with a full promotion workflow to the Vulnerability Register.
For complete documentation, see Vulnerability Scanning.