Incident Response
The Incident Response module manages security incidents through their full lifecycle following the NIST SP 800-61 framework. Each incident gets a full-page workspace with a NIST phase stepper, five content tabs (Overview, Timeline, Runbook, Notifications, After-Action Review), and integrated evidence and remediation tracking. The module supports automated playbook activation, breach notification compliance, response metrics calculation, and AI-assisted post-incident analysis.
Overview
Access from Incident Response > Incidents in the sidebar. The page has two top-level tabs: Incidents and Settings.
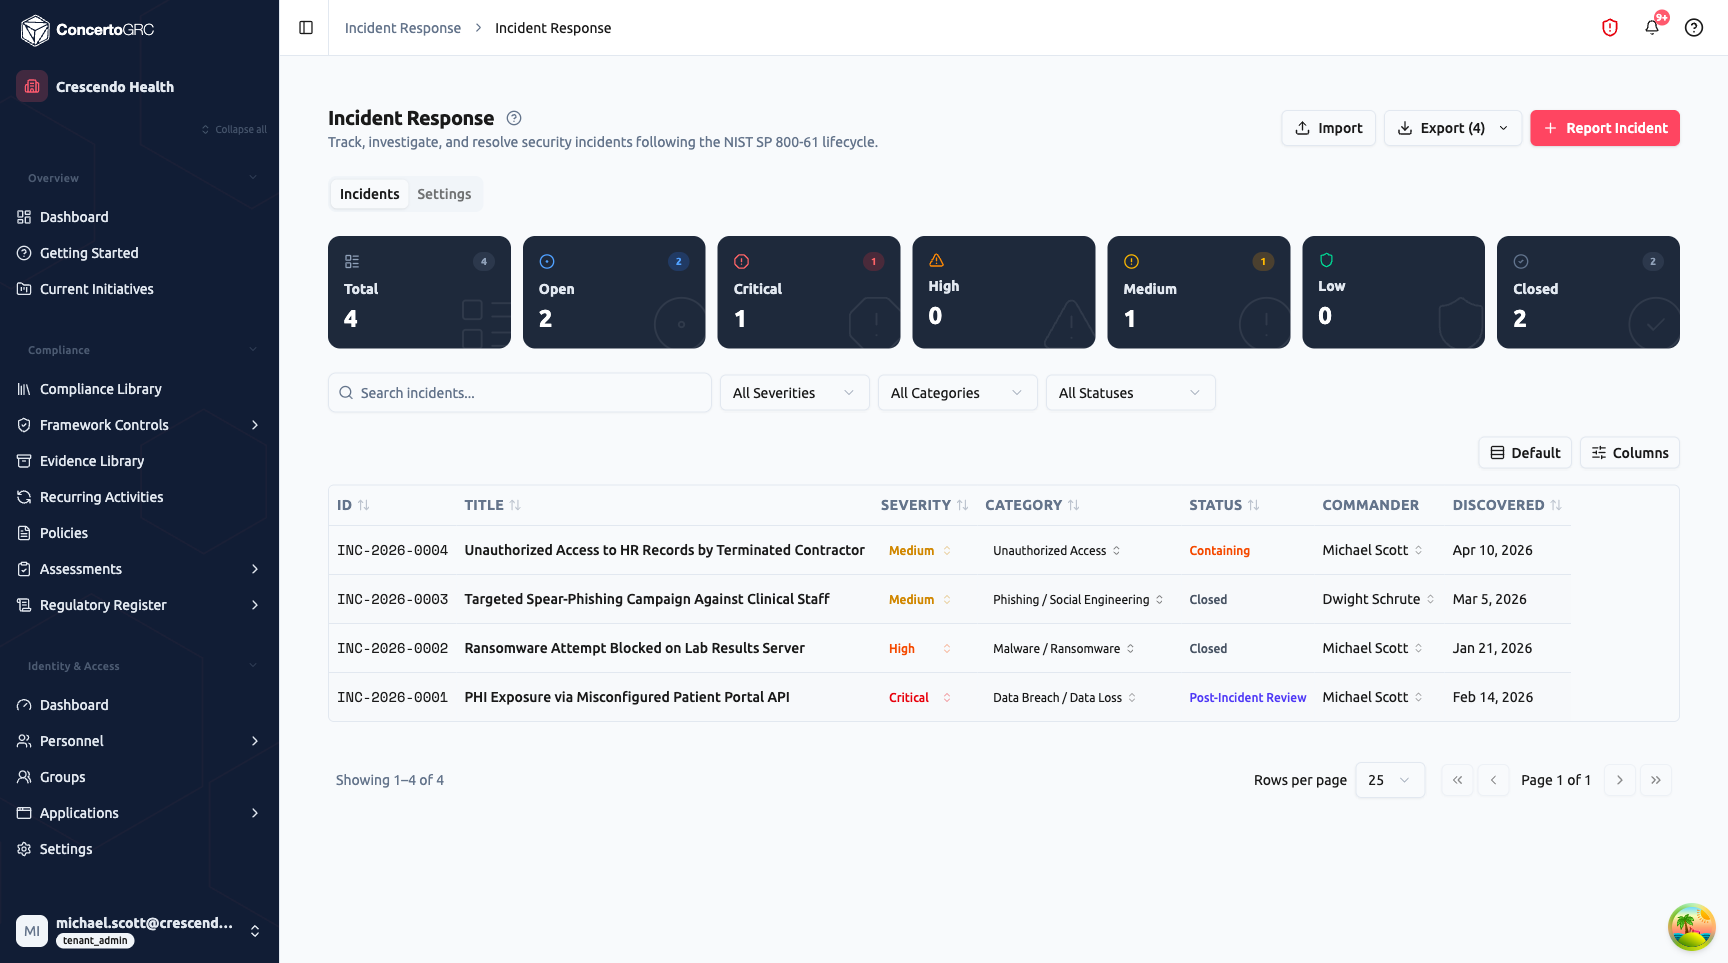
Summary Statistics
The top bar shows live counts:
- Total -- All incidents
- Open -- Non-closed incidents (any active status)
- Critical / High / Medium / Low -- Counts by severity
- Closed -- Resolved or false positive incidents
Click any stat card to filter the table.
Incident Table
The table shows all incidents with sortable columns:
- ID -- Auto-generated incident number (e.g., INC-2026-0001)
- Title -- Incident summary (click to navigate to full-page detail)
- Severity -- Critical, High, Medium, or Low (color-coded, inline editable)
- Category -- Incident type (Data Breach, Malware, Phishing, etc.)
- Status -- Current lifecycle status (inline editable)
- Commander -- Incident commander (inline editable)
- Discovered -- Date the incident was detected
Use the filter bar to search by text, filter by severity, category, or status. Additional columns available via the Columns button.
Reporting an Incident
Click + Report Incident to open the 5-step reporting wizard.
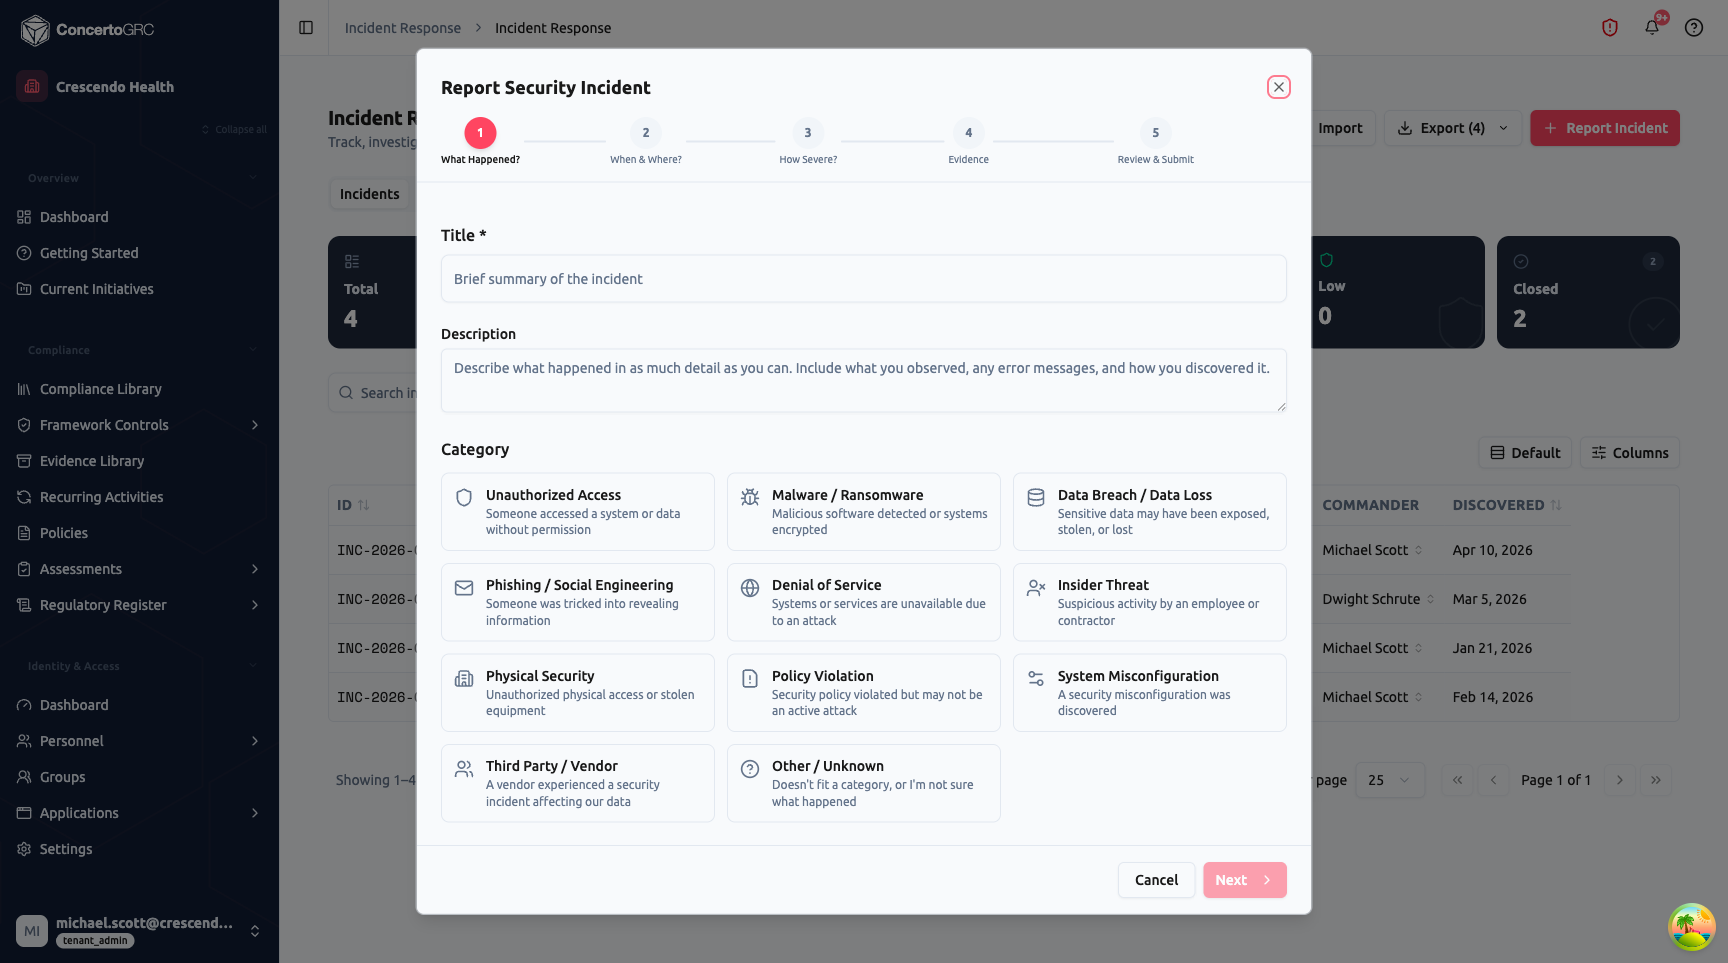
Step 1: What Happened?
- Title (required) -- Brief summary of the incident
- Description -- Detailed account of what was observed
- Category -- Select from 11 categories, each with an icon and description:
- Unauthorized Access, Malware / Ransomware, Data Breach / Data Loss, Phishing / Social Engineering, Denial of Service, Insider Threat, Physical Security, Policy Violation, System Misconfiguration, Third Party / Vendor, Other / Unknown
Step 2: When & Where?
- When Discovered (required) -- Date and time the incident was first identified
- When Likely Started -- Estimated occurrence time
- Affected Systems -- Search and select from your product and vendor registries
- Affected Data Types -- Multi-select: PII, PHI, CHD (Payment Card), Financial, Credentials, IP, None Known
Step 3: How Severe?
- Severity Level -- Choose Critical, High, Medium, or Low (each with a description card)
- Estimated Records Affected -- Dropdown range (Unknown, Under 100, 100–1K, 1K–10K, 10K–100K, 100K+)
Step 4: Evidence
- Attachments -- Upload supporting files
- Links -- Add URLs with optional descriptions
- Additional Notes -- Free-form context
Step 5: Review & Submit
Summary of all information with edit buttons to jump back to any step. On submit, the system assigns an incident number and notifies the response team.
Incident Detail Workspace
Click any incident row to navigate to its full-page workspace. The workspace consists of a persistent header with the NIST phase stepper and five content tabs.
Workspace Header
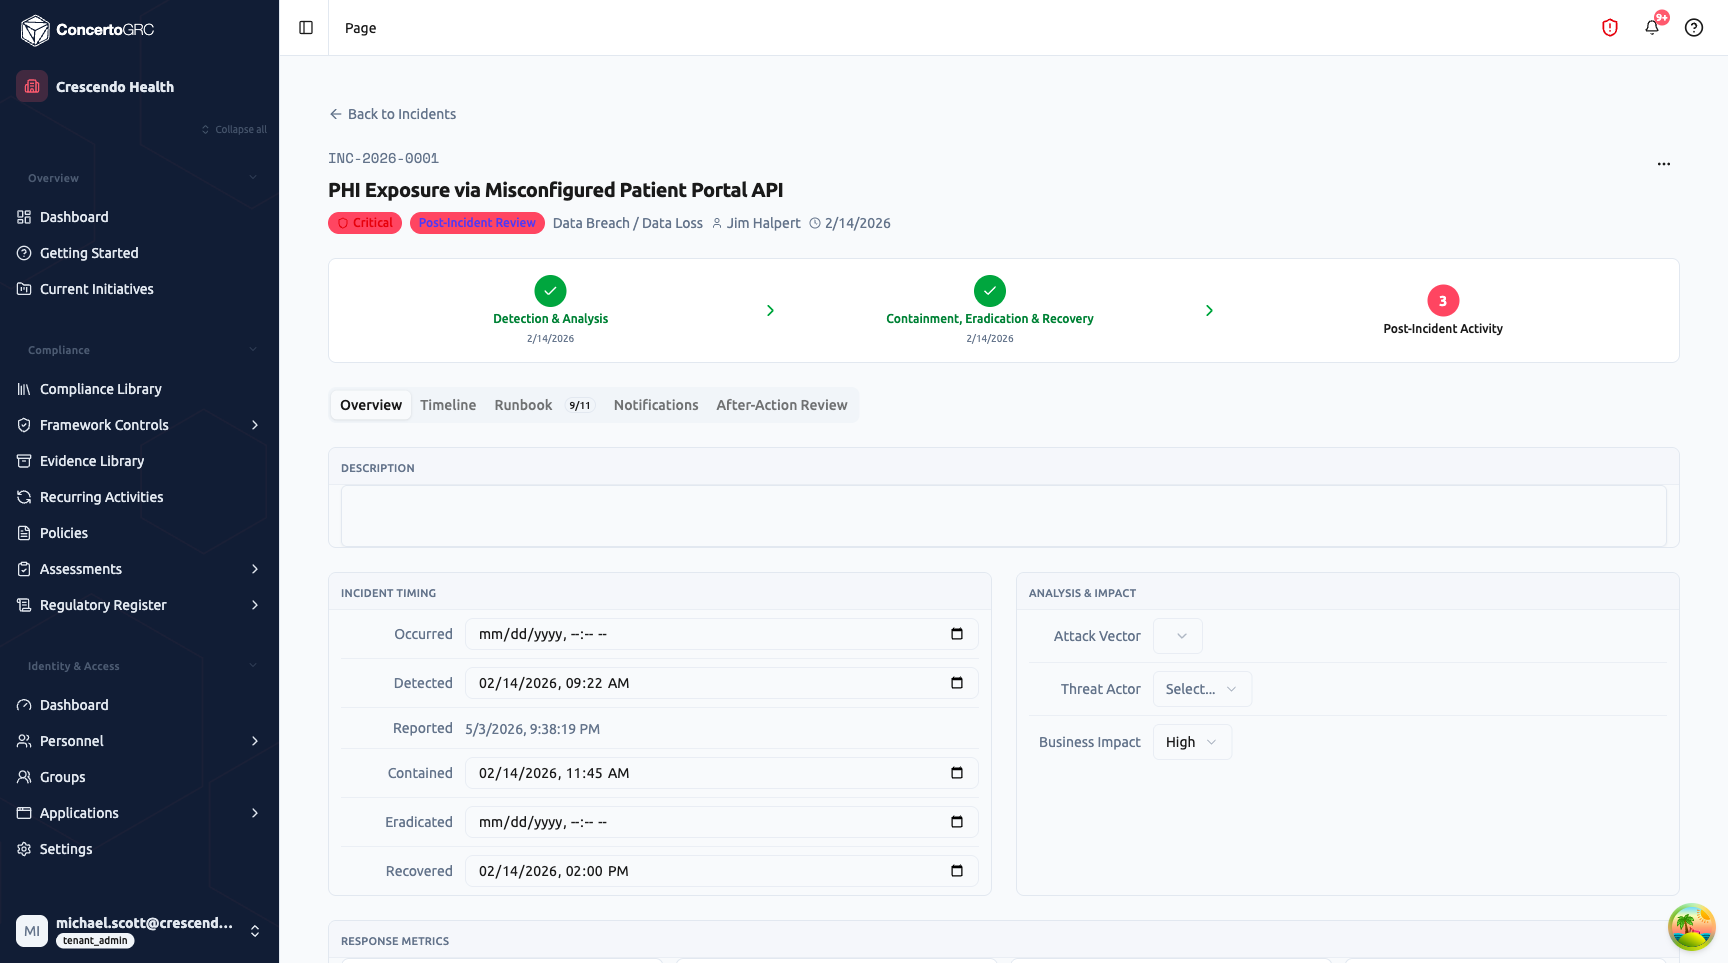
The header displays:
- Incident Number -- Auto-generated (e.g., INC-2026-0001)
- Title -- Incident summary
- Severity Badge -- Color-coded (Critical = red, High = orange, Medium = yellow, Low = blue)
- Status Badge -- Current lifecycle status
- Category -- Incident type
- Commander -- Assigned incident commander
- Discovered Date -- When the incident was detected
NIST Phase Stepper: A three-phase progress indicator aligned to NIST SP 800-61:
- Detection & Analysis -- Initial identification, triage, and scope assessment
- Containment, Eradication & Recovery -- Stop the threat, remove root cause, restore operations
- Post-Incident Activity -- After-action review, lessons learned, remediation planning
Each phase shows a green checkmark when completed with the completion date, or the current step number when active. The stepper updates automatically as the incident status progresses.
Overview Tab
The Overview tab contains the core incident information:
Description -- Rich text editor for detailed incident narrative.
Incident Timing:
- Occurred -- When the incident actually started
- Detected -- When it was first identified
- Reported -- When it was formally reported in the system
- Contained -- When the threat was stopped
- Eradicated -- When the root cause was removed
- Recovered -- When normal operations resumed
Timestamps auto-populate on status transitions but can be manually adjusted.
Analysis & Impact:
- Attack Vector -- How the incident occurred
- Threat Actor -- Who or what caused it
- Business Impact -- Severity of operational impact (Low, Medium, High, Critical)
Response Metrics: Four auto-calculated metric cards:
- Time to Detect (TTD) -- Occurred > Detected
- Time to Contain (TTC) -- Detected > Contained
- Time to Recover (TTR) -- Contained > Recovered
- Total Duration -- Occurred > Recovered
Root Cause & Lessons Learned -- Free-text fields for post-incident analysis.
Affected Systems -- Track compromised systems with impact type (Data Exfiltration, Unauthorized Access, Denial of Service, Data Modification, No Impact) and recovery status (Compromised, Contained, Recovered, Verified Clean). Systems can be linked to products or vendors.
Affected Data -- Track exposed data types (PII, PHI, PCI, Financial, Credentials, IP, Other) with record counts, sensitivity level, and confirmation status. A Total Individuals Affected counter rolls up across all data types.
Timeline Tab
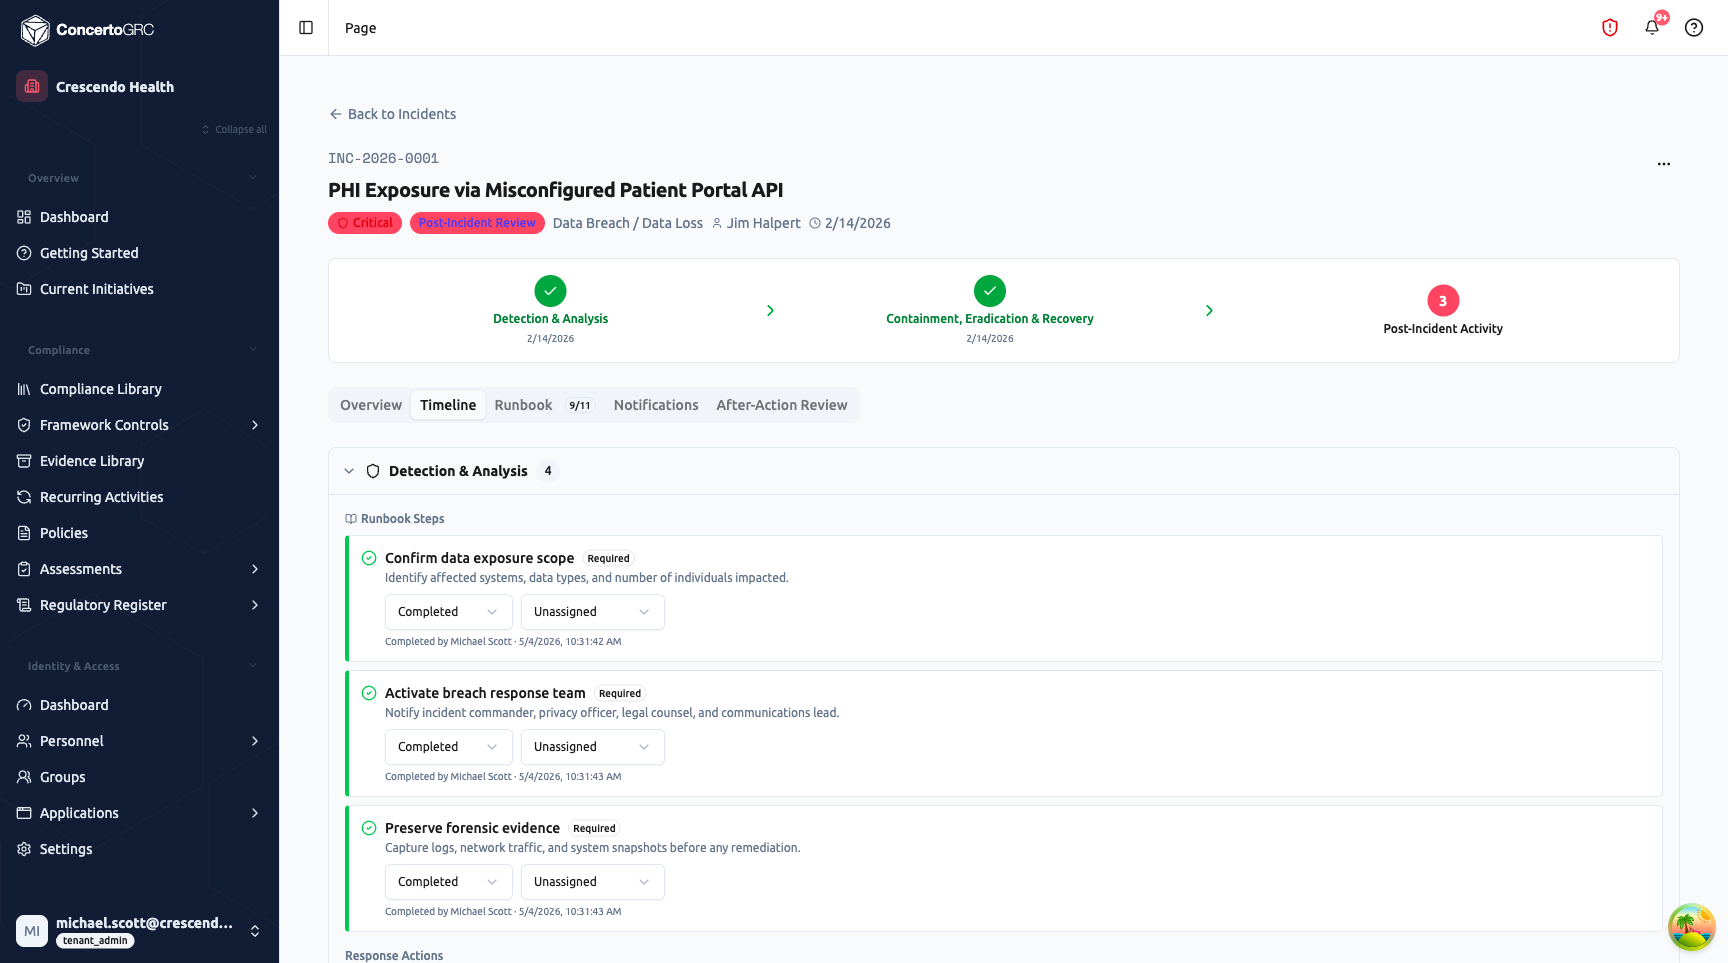
The Timeline tab provides a vertical timeline view of all incident activity, organized by NIST response phase:
- Detection & Analysis -- Initial detection, triage, and scope assessment entries
- Containment -- Actions taken to stop the threat
- Eradication -- Root cause removal activities
- Recovery -- Service restoration entries
- Post-Incident -- After-action review and lessons learned
Each phase section shows:
- Runbook Steps -- Steps from the activated playbook with status (Completed, In Progress, Not Started, Skipped), assignee, and completion timestamps
- Response Actions -- Documented containment, eradication, and recovery actions with effectiveness tracking
- Timeline Entries -- Chronological events including status changes, severity changes, notes, notifications, escalations, and team changes
Add new actions or notes inline within each phase section.
Runbook Tab
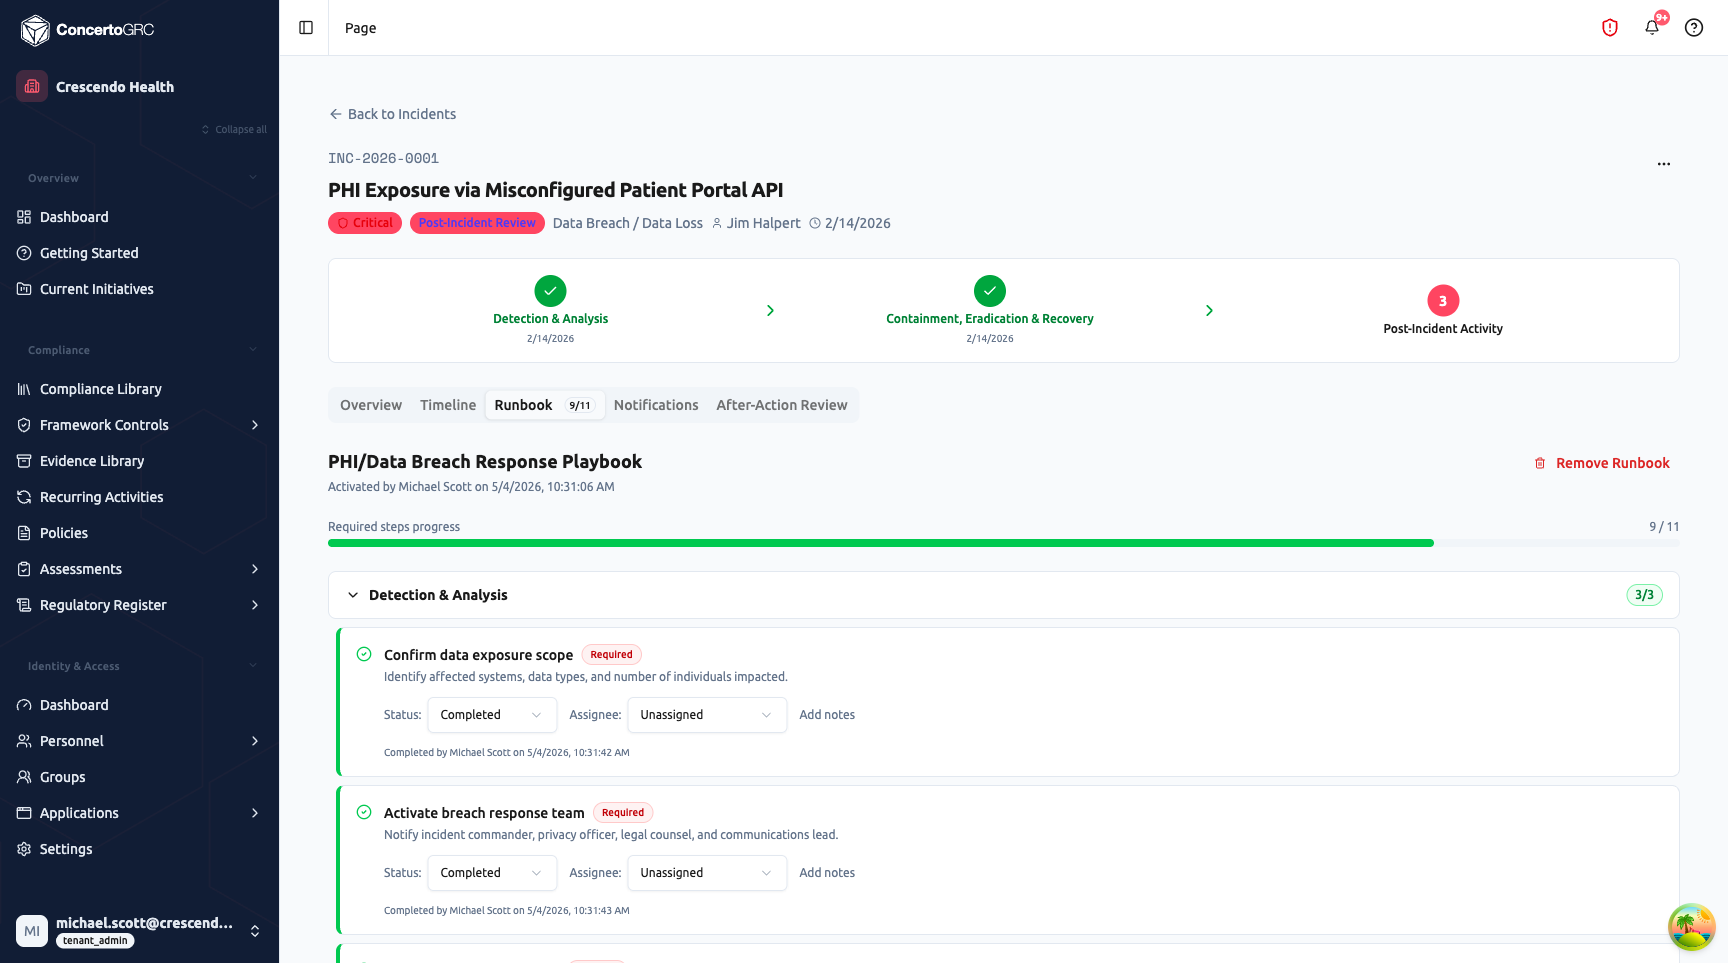
The Runbook tab manages playbook-driven response procedures:
Playbook Activation: When no runbook is active, click Activate Runbook to select a playbook from your configured playbooks. Playbooks can also auto-activate based on incident category.
Active Runbook: Once activated, the runbook shows:
- Playbook Name -- Which playbook is in use, with activation timestamp
- Required Steps Progress -- Progress bar showing completed/total required steps
- Phase Groups -- Steps organized by NIST phase (Detection & Analysis, Containment, Eradication, Recovery, Post-Incident) with per-phase completion badges
Each step displays:
- Title and Description -- What needs to be done
- Required Badge -- Whether the step is mandatory
- Status -- Not Started, In Progress, Completed, or Skipped
- Assignee -- Who is responsible
- Notes -- Step-specific documentation
- Completion Timestamp -- When marked complete
Notifications Tab
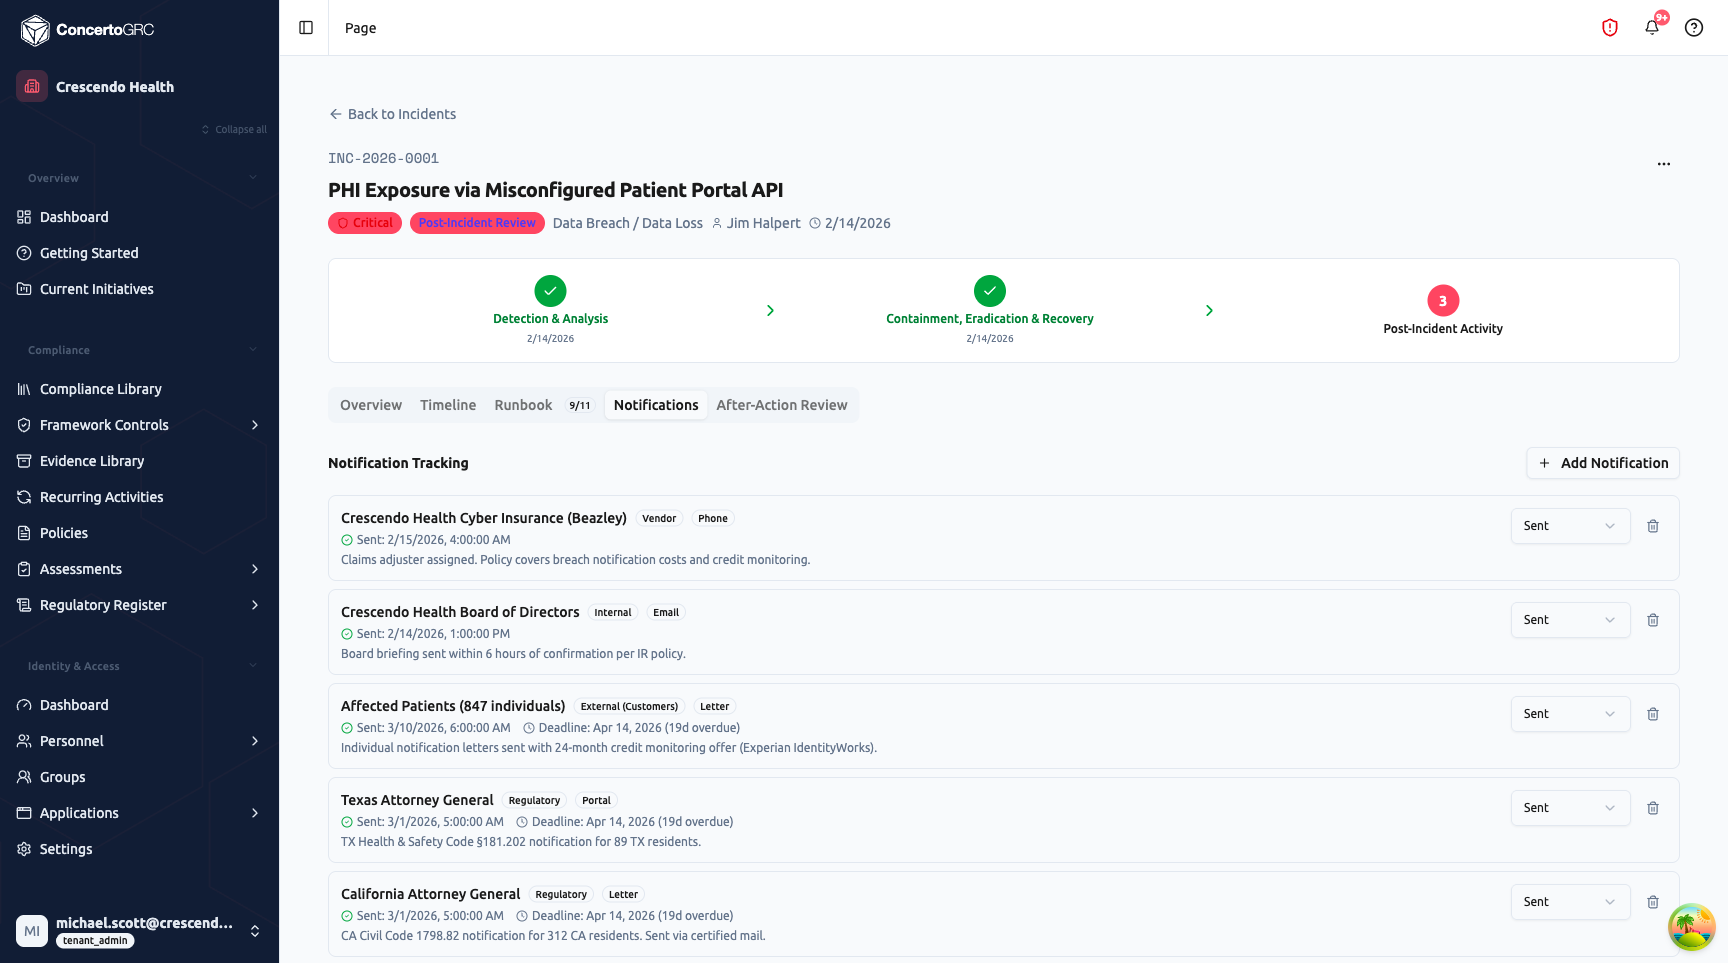
The Notifications tab tracks breach notification compliance:
- + Add Notification -- Create a new notification record
- Recipient -- Who was notified (individuals, regulators, internal teams, vendors, law enforcement)
- Type -- Internal, Regulatory, External (Customers), Vendor, or Law Enforcement
- Method -- Email, Phone, Letter, In-Person, or Portal
- Status -- Pending, Sent, or Not Required
- Sent Date -- When the notification was delivered
- Deadline -- Regulatory deadline with overdue indicator (shows days overdue in red)
- Notes -- Context about the notification (reference numbers, statutory requirements)
This tab is essential for HIPAA, state breach notification laws, and GDPR compliance where notification deadlines are legally mandated.
After-Action Review Tab
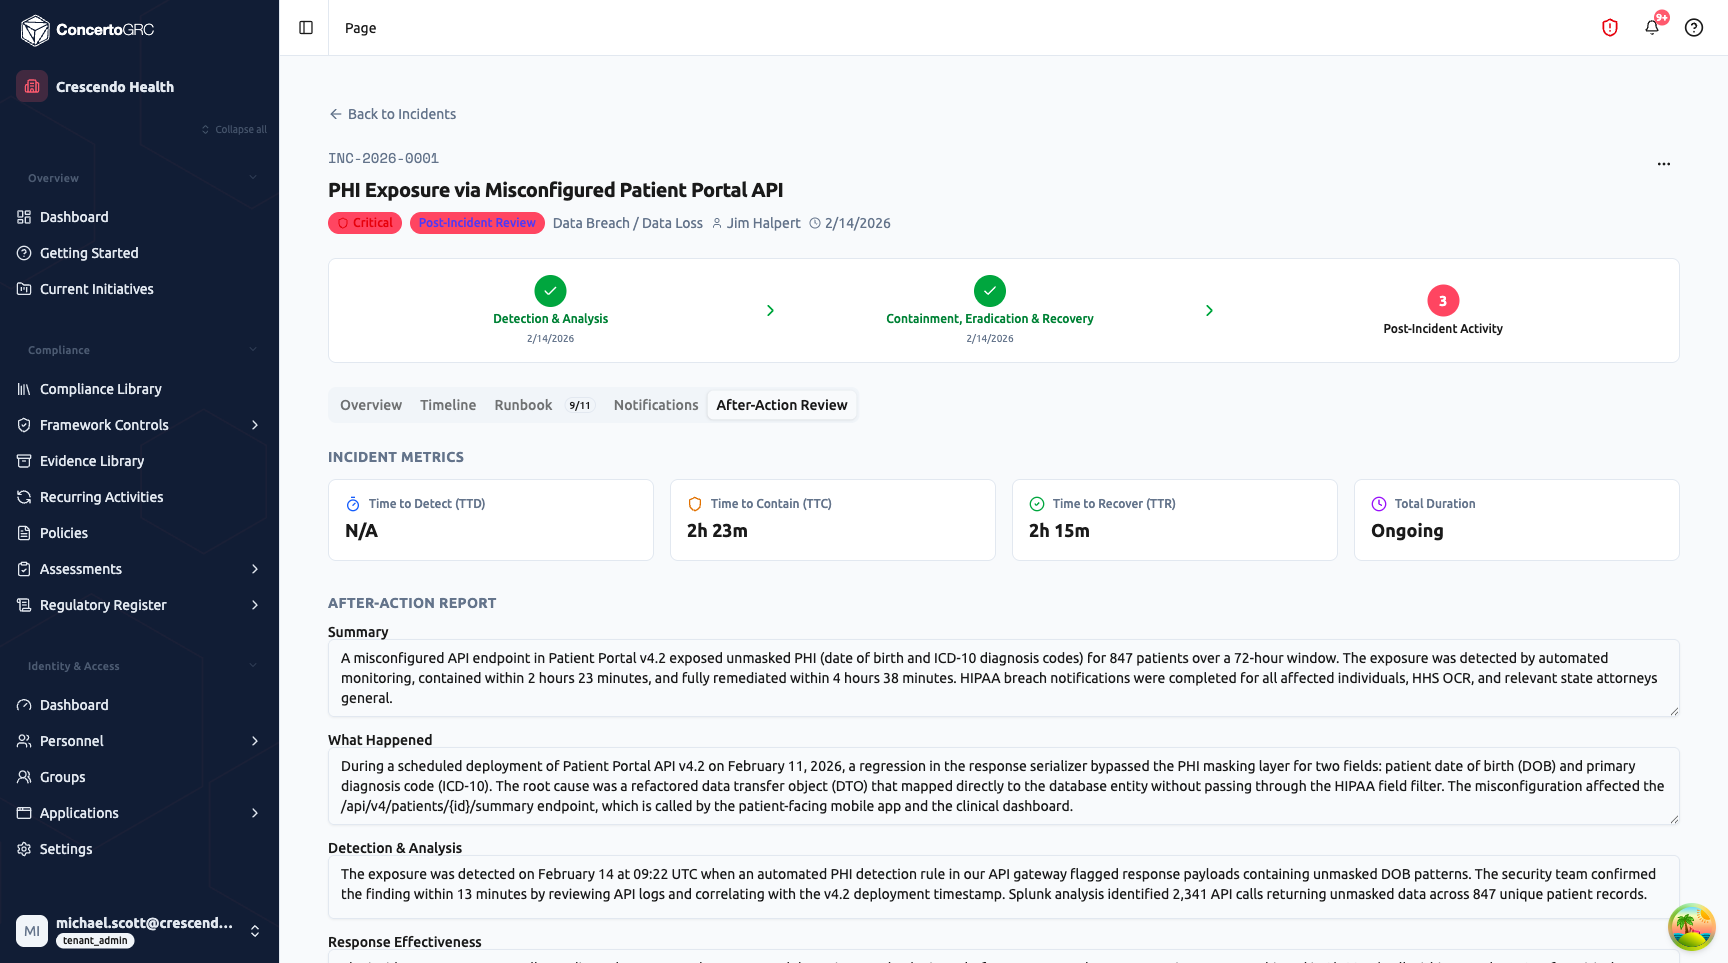
The After-Action Review tab provides structured post-incident analysis:
Incident Metrics: Four reference cards showing Time to Detect (TTD), Time to Contain (TTC), Time to Recover (TTR), and Total Duration -- calculated from incident timestamps.
After-Action Report: Eight structured narrative fields with autosave:
- Summary -- High-level overview of the incident and its resolution
- What Happened -- Detailed chronological account of events
- Detection & Analysis -- How the incident was detected and initially assessed
- Response Effectiveness -- Evaluation of the response actions taken
- Root Cause Analysis -- What caused the incident and contributing factors
- Impact Assessment -- Business, operational, and compliance impact
- Remediation Summary -- Actions taken to prevent recurrence
- Lessons Learned -- Key takeaways and process improvements
AI-Assisted Drafting: Click the AI button to generate draft content for all eight fields based on the incident's timeline, actions, and metadata. Review and edit the AI suggestions before finalizing.
Remediation Actions: Create and track follow-up remediation actions directly from the after-action review. Each action has a description, owner, due date, status, and source reference.
Review Status: The after-action review progresses through: Draft > In Review > Approved. Critical and High severity incidents require an approved after-action review before the incident can be closed.
Incident Lifecycle
REPORTED > TRIAGING > CONFIRMED > CONTAINING > CONTAINED
                                                    ↓
                                              ERADICATING > RECOVERING > RECOVERED
                                                                            ↓
                                                                    POST_INCIDENT_REVIEW > CLOSED

Any state > FALSE_POSITIVE (terminal)
| Status | NIST Phase | Description |
|---|---|---|
| Reported | Detection & Analysis | Incident submitted, awaiting triage |
| Triaging | Detection & Analysis | Commander assessing severity and scope |
| Confirmed | Detection & Analysis | Verified as a real incident |
| Containing | Containment, Eradication & Recovery | Active containment in progress |
| Contained | Containment, Eradication & Recovery | Threat stopped, damage limited |
| Eradicating | Containment, Eradication & Recovery | Removing root cause |
| Recovering | Containment, Eradication & Recovery | Restoring normal operations |
| Recovered | Containment, Eradication & Recovery | Operations restored |
| Post-Incident Review | Post-Incident Activity | After-action review in progress |
| Closed | -- | Incident fully resolved and documented |
| False Positive | -- | Determined not to be a real incident |
Status transitions are enforced -- you can only move forward through the lifecycle. Timestamps (containedAt, eradicatedAt, recoveredAt, closedAt) auto-populate on transitions.
Incident Categories
| Category | Description |
|---|---|
| Unauthorized Access | Someone accessed a system or data without permission |
| Malware / Ransomware | Malicious software detected or systems encrypted |
| Data Breach / Data Loss | Sensitive data may have been exposed, stolen, or lost |
| Phishing / Social Engineering | Someone was tricked into revealing information |
| Denial of Service | Systems or services unavailable due to an attack |
| Insider Threat | Suspicious activity by an employee or contractor |
| Physical Security | Unauthorized physical access or stolen equipment |
| Policy Violation | Security policy violated but may not be an active attack |
| System Misconfiguration | A security misconfiguration was discovered |
| Third Party / Vendor | A vendor experienced a security incident affecting your data |
| Other / Unknown | Doesn't fit a category, or category is not yet determined |
Severity Levels
| Severity | Description |
|---|---|
| Critical | Significant business impact, active data exfiltration, or widespread system compromise |
| High | Confirmed security breach with potential for significant damage |
| Medium | Security event requiring investigation with limited immediate impact |
| Low | Minor security event with minimal business impact |
Commander Triage
When an incident is first reported (Reported or Triaging status), the workspace shows a Commander Triage Banner at the top of the Overview tab. The triage workflow allows the commander to:
- Adjust severity based on initial assessment
- Assign or reassign the incident commander
- Confirm Incident -- Advance to Confirmed status and begin response
- False Positive -- Mark as not a real incident (terminal state)
Playbook Configuration
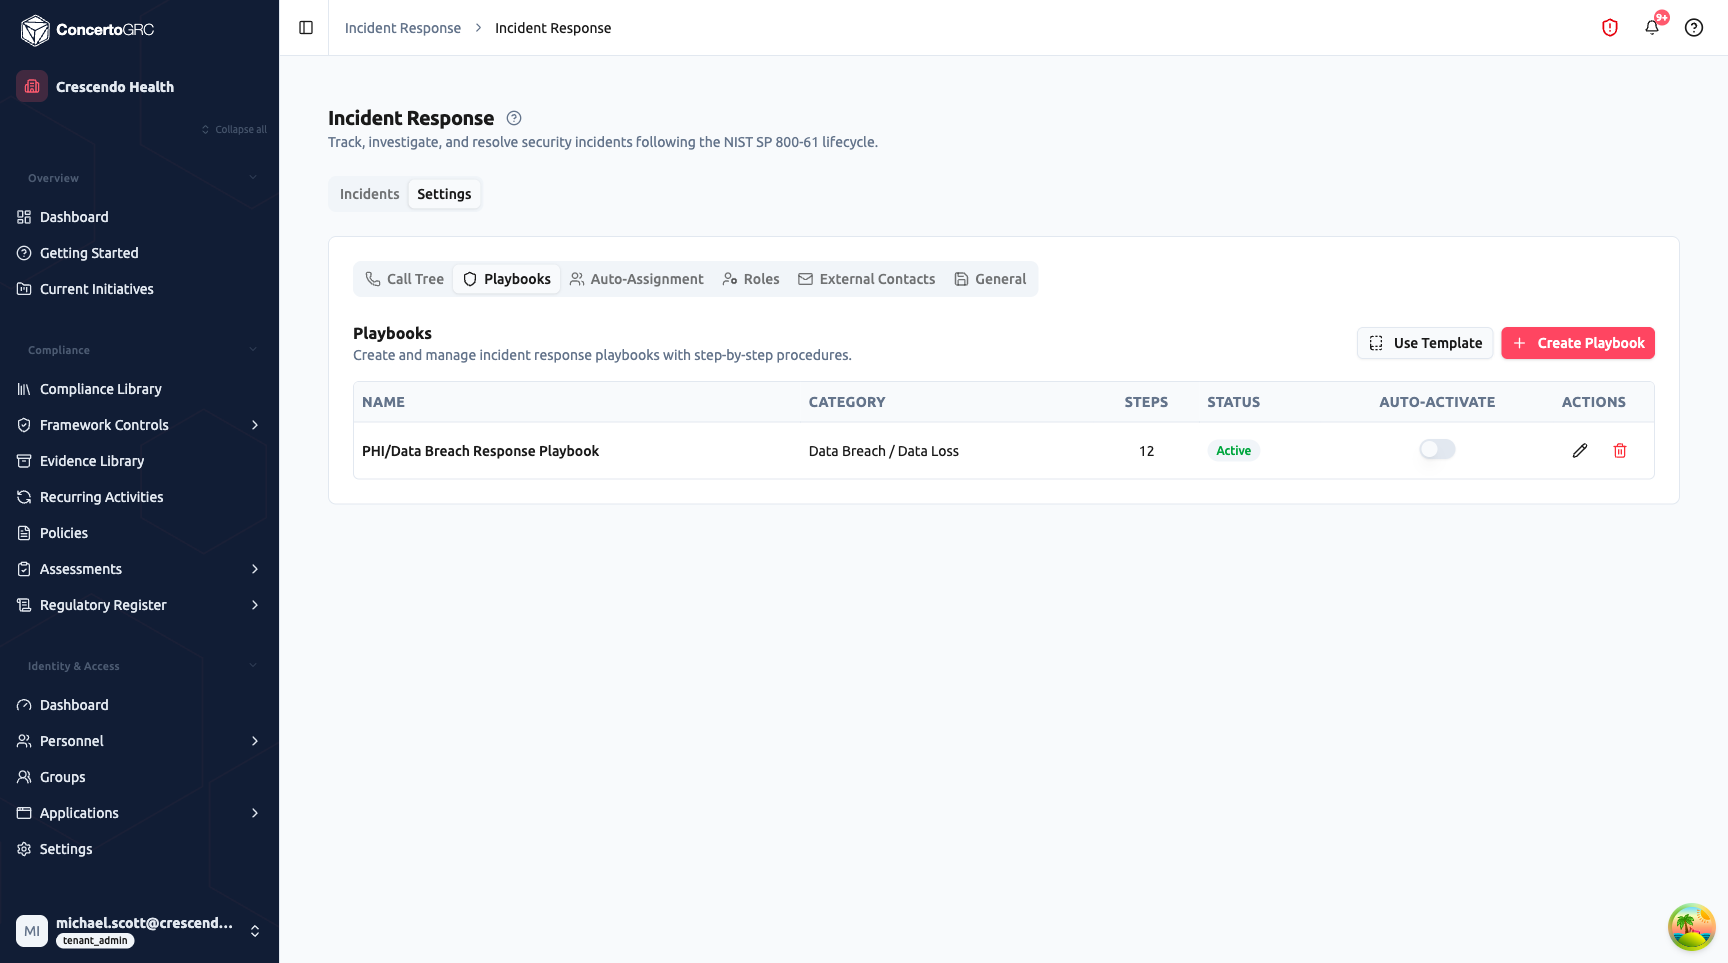
Configure response playbooks from Incidents > Settings > Playbooks:
- Create Playbook -- Define a custom playbook with name, category, and ordered steps
- Use Template -- Deploy from platform-provided playbook templates
- Steps -- Each step has a title, description, NIST phase, required/optional flag, and default assignee role
- Auto-Activate -- Toggle to automatically activate when an incident matching the category is created
- Status -- Draft or Active
When activated on an incident, the playbook creates a runbook -- a snapshot of the steps that can be tracked independently.
IR Settings
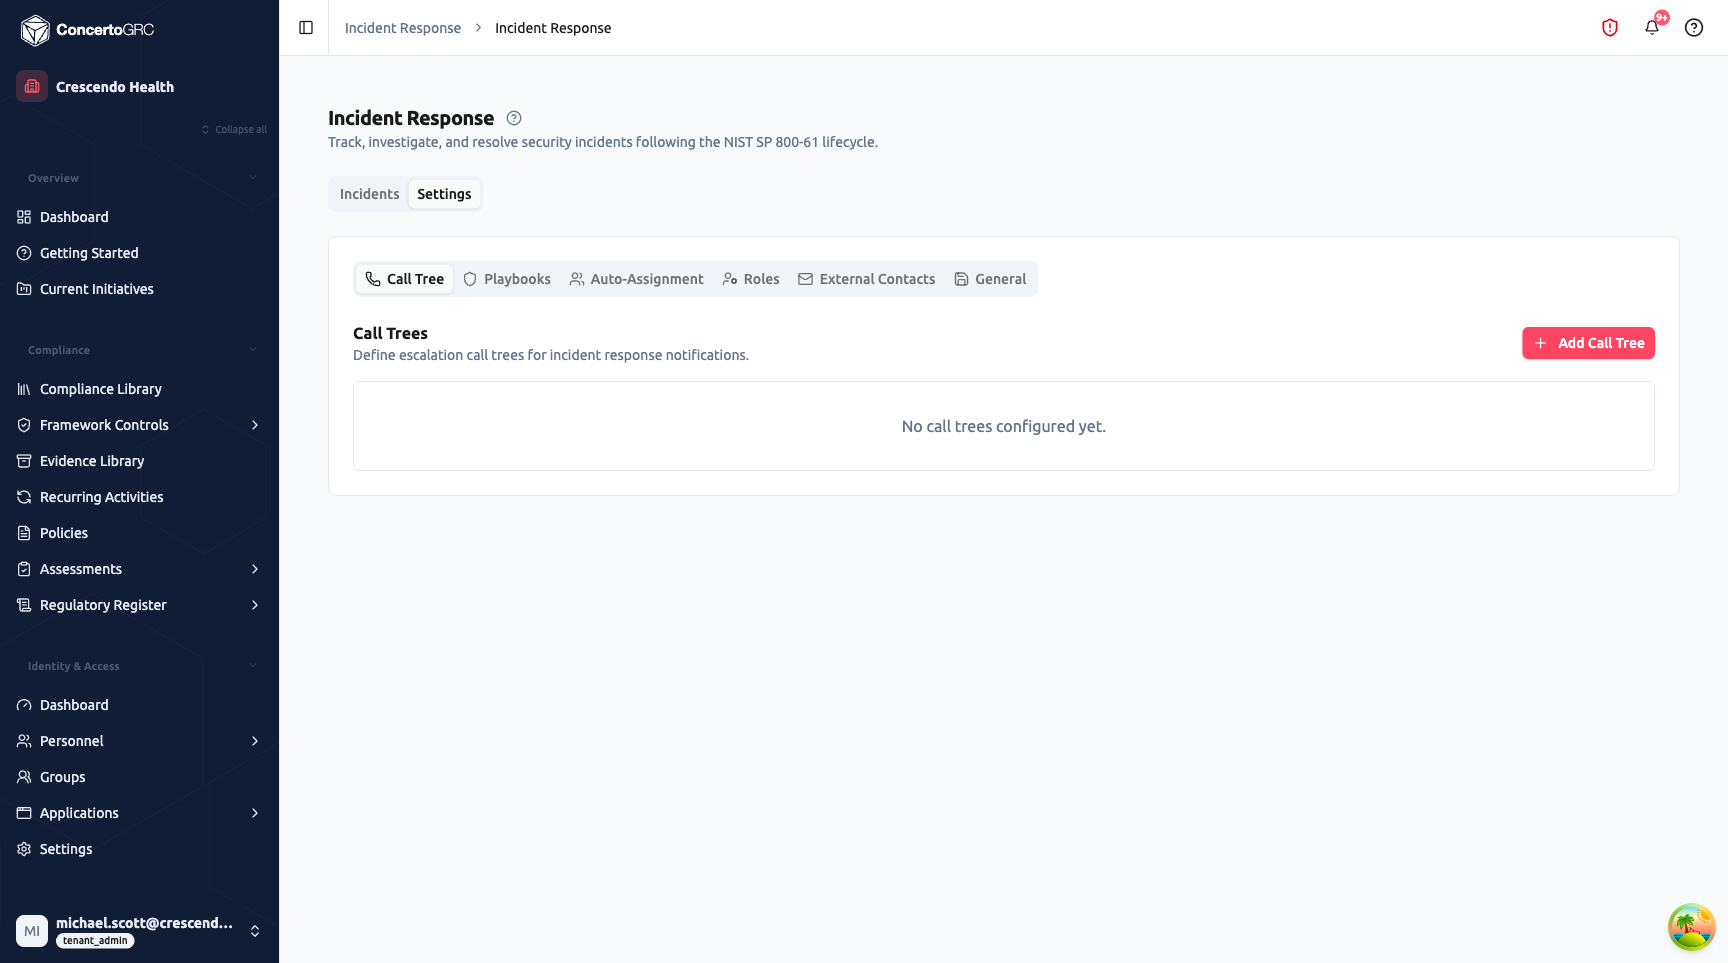
Access from Incidents > Settings. Six configuration sub-tabs:
Call Tree
Define escalation call trees for incident notifications. Each call tree has severity-triggered tiers with escalation delays and assigned contacts (internal users and/or external contacts). Test call trees with a one-click test alert.
Playbooks
Create and manage response playbooks with NIST-phased steps. Deploy from templates or create custom playbooks. See Playbook Configuration above.
Auto-Assignment
Rules that automatically assign an incident commander based on severity and/or category. Rules evaluate in priority order -- the first matching rule wins.
Roles
Define incident response roles (Incident Commander, Security Analyst, IT Admin, Legal, etc.) and assign team members to each role. Roles are referenced in playbook step assignments.
External Contacts
Store non-platform contacts for incident response: legal counsel, IR firms, insurance carriers, law enforcement, regulators, and PR/communications. Each contact has name, organization, title, email, phone, and category.
General
Global IR configuration:
- Incident ID Prefix -- Customize the prefix (e.g., "INC" for INC-0001)
- Auto-Close After N Days -- Automatically close resolved incidents after a set period
- Require After-Action Review -- Enforce after-action review completion before closure
- Retention Period -- How long to retain incident records (in years)
Response Metrics
The module automatically calculates key response metrics from incident timestamps:
| Metric | Calculation | Target |
|---|---|---|
| Time to Detect (TTD) | Occurred > Detected | Minimize detection gap |
| Time to Contain (TTC) | Detected > Contained | Critical: under 4h, High: under 24h |
| Time to Recover (TTR) | Contained > Recovered | Minimize recovery time |
| Total Duration | Occurred > Recovered | End-to-end incident lifecycle |
Metrics display in the Overview tab's Response Metrics section and in the After-Action Review tab's Incident Metrics cards.
AI Features
After-Action Draft Generation
In the After-Action Review tab, AI generates draft content for all eight narrative fields based on the incident's timeline, actions, affected systems, notifications, and metadata. The system also suggests remediation actions based on the root cause analysis.
Category Classification
When reporting an incident, AI can analyze the description to suggest the most appropriate category.
Import & Export
Import
Click Import to bulk-import incidents via CSV.
| Column | Required | Accepted Values |
|---|---|---|
| Title | ✓ | Free text |
| Description | -- | Free text |
| Severity | -- | CRITICAL, HIGH, MEDIUM, LOW |
| Status | -- | REPORTED through CLOSED |
| Incident Date | -- | YYYY-MM-DD |
| Lead | -- | Email or name |
Export
Click Export to download all incidents as CSV. The count is shown in the button (e.g., "Export (4)").